
Part of TECHJAJA’S GUIDE TO WORKING FROM HOME
Google is using location data gathered from smartphones of Ugandans to help public health officials understand how people’s movements have changed in response to the global COVID-19 pandemic. In a blog post early Friday morning, Google announced the release of its COVID-19 Community Mobility Reports.
The report uses data from people who have opted in to storing their location history with Google to help illustrate the degree to which people are adhering to government imposed quarantine for people to stay at home and for those who are privileged enough– work from home. In the blog post the company explained further how they get the data and said;
In Google Maps, we use aggregated, anonymized data showing how busy certain types of places are — helping identify when a local business tends to be the most crowded. We have heard from public health officials that this same type of aggregated, anonymized data could be helpful as they make critical decisions to combat COVID-19.
Each report contains information about movement patterns in six categories:
- Retail and recreation, covering visits to restaurants, cafes, shopping centers, theme parks, museums, libraries, movie theaters, and similar locations.
- Grocery and pharmacy, covering supermarkets, food warehouses, farmers markets, specialty food shops, and drug stores.
- Parks, covering public beaches, marinas, dog parks, plazas, and other public spaces.
- Transit stations, covering subway stops and bus and train stations.
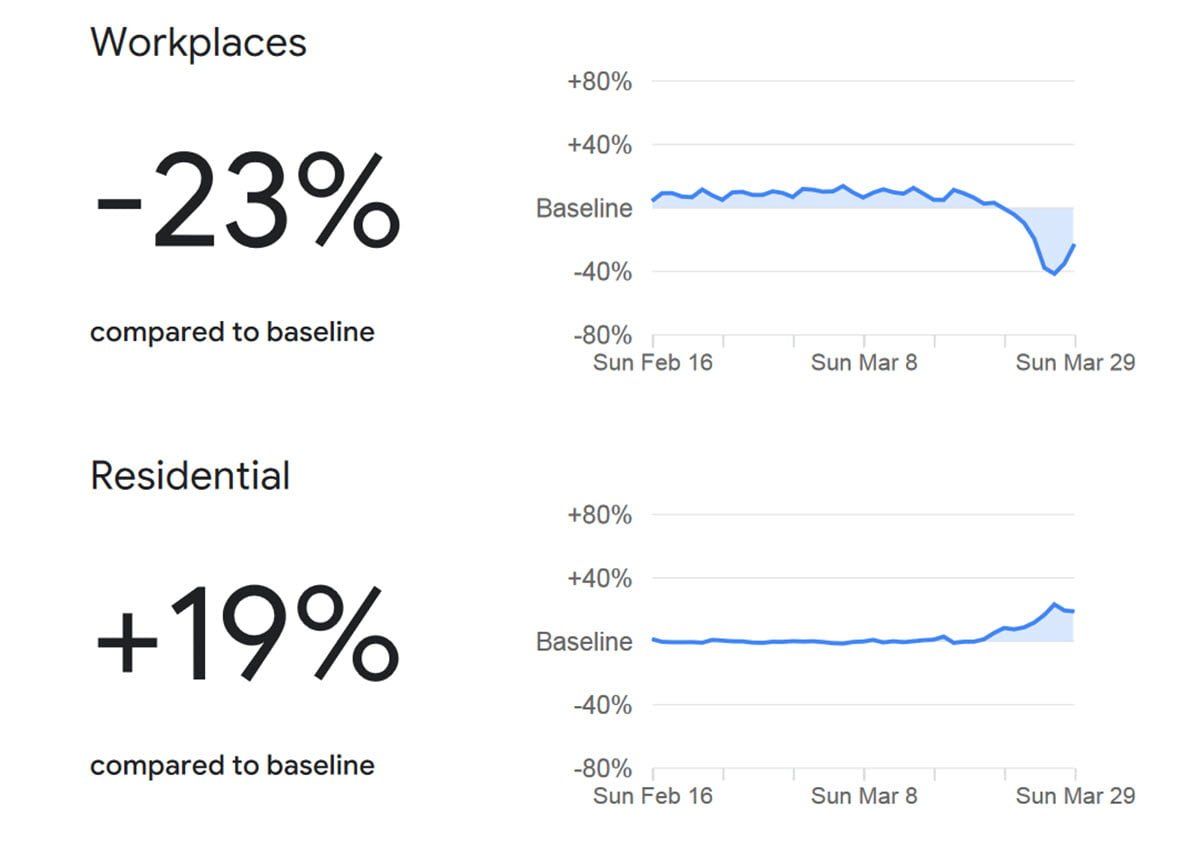
- Workplaces, covering offices.
- Residences, covering people’s homes.
READ MORE: CODIV-19: How Ugandan company leaders should guide their teams on Working Remotely
The statistics clearly show that there has been a 19% increase in internet usage in residential homes and 23% drop in office internet usage in Uganda. Mobility trends for places like public transporthubs such as taxi, bus, and train stations had the biggest drop by 59%. The report also indicates that places like restaurants,cafes, shopping centers, theme parks,museums, libraries, and movie theaters have had a 50% drop in internet usage.
Anyone can view the reports, which cover 131 countries to start. In many locations, users can search for more regional data, examining reports for individual states, provinces, and counties. After the user selects a geographic region, Google will generate a PDF with the data it has collected. Google said that it chose PDFs over web pages because they could be more easily downloaded and shared with workers in the field.